Dear Readers,
I hope everyone is surviving in this current Financial Markets drawdown or selloff since the start of the year 2022, we have reach the 5th month of the drawdown since January to current May.
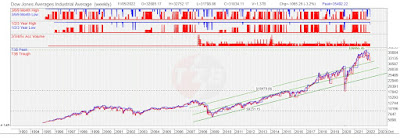
I would like to refresh on the current situation of drawdown and selloff not amounting to a near term Recession which will be brought as a result of possibly a drawdown of 50% and beyond from all time high peak in January 2022.
Financial Markets has overly reacted to repercussions of high commodities price especially driven by current ongoing geopolitical conflict Russia and Ukraine where Ukraine and Russia are agricultural and energy producers export to the world affecting supply chain disruptions and economic sanctions imposed on Russia.
High inflation data point in US has peak in March 2022 at 8.5% and current data point in April registered at 8.3%, 0.2% reduction since March 2022 Federal Reserve raise 0.25% Federal Reserve Funds interest rate hike.
Data suggest inflation has peak and could retrace to 5% and below in coming months as a result of interest rate hike in March (25bps), May (50bps) and possibility of June (0.75bps) hike where current Financial Markets drawdown has priced in a probability 100% of 50bps to 75bps interest rate hike.
https://www.allquant.co/post/may-2022-post-fomc-interest-rate-update?fbclid=IwAR0B_IAcAliV_ZGC5iOP4YEtekhD67hF-REX94iWYbt1xtmvNFOd5mae0ec
Inflation data retracement to 5% below could also be influence by the firstly by geopolitical conflict peaceful resolution ceasefire which could see high commodities price taking a breather arising from embargo and economic sanctions, supplies chain disruptions, Secondly, Shanghai China ommicron infections dwindled and ease lockdown in Shanghai where manufacturing and port (automate logistics truck drivers and port operations ) resuming activities. Thirdly, US end trade war with China abolish or partially abolish trade tariffs on Chinese goods to combat inflation raging rampantly.
https://tradingeconomics.com/united-states/inflation-cpi
I would like to update on an opportunity now up for grab should the Financial Market has reached the bottom.
Financial Markets usually forward guidance looking based on expectations on inflation data point to signs of abating will react positively.
https://corporatefinanceinstitute.com/resources/knowledge/valuation/forward-pe-ratio/
Current fund flow data points to 0% probability for Recession, for the next 2-3 years for global economies are recovering from post Covid 19 induced recession 2 years on since year 2020 where global Financial Markets drawdown was between 26% to 40%.
Bull market on average last 5 years and 2 months so Bull market are forecast to end sometime in 2025 but it could drag longer to 10 years. We are going to reach Centennial milestone of year 1929 Great Depression by year 2029.
https://therobusttrader.com/how-long-do-bull-markets-last/#:~:text=On%20average%2C%20a%20bull%20market%20lasts%20for%20about,bull%20markets%20are%20much%20longer%20than%20bear%20markets.
Technical Analysis
S&P 500 - Weekly
S&P 500 all time high was 4818.62 on 3 Jan 2022 had drawdown computed to 11 May low 3928.82 was a difference of 889.80 (18.46%) which we observed SPX has pullback and retrace to upper channel lines of the price channel.Quants Algorithm
SPY
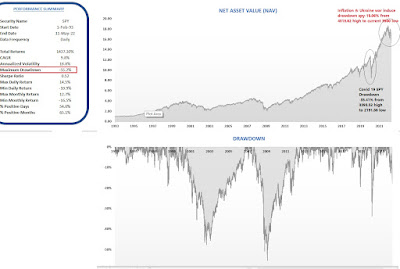
SPY drawdown of 55.2% happened during the subprime mortgage crisis in 2007-2009 of that magnitude scale based on historical data. current year 2022 drawdown for SPY is estimated 19.06% slightly over 20% level coin as Technical Bear market.
QQQ
QQQ drawdown of 83% happened during the Dot.com bubble crisis in 2000 -2003 of that magnitude scale based on historical data. current year 2022 drawdown for QQQ high was 408.71 to 11 May low of 290.95 is estimated 28.81% surpassed 20% level coin as Technical Bear market.
Strong US Dollar
Recent opinion poll conducted by Washington Post/ABC News survey points to overall approval rating for President Biden and his Democrats Party Cadres was at 42%, The poll finds President Biden's approval rating on the economy stands at 38% down from 52% a year ago and just 28% approve of the way the president is handling inflation compare with 68% who disapprove.
https://sg.news.yahoo.com/poll-day-biden-approval-rating-225621306.html
President Biden has to act fast and doublely hard to win back approval ratings because Mid Term Elections is fast approaching in November 2022, does President Biden wish to crash the Financial Markets under his watch with a hard landing, most Americans are suffering having to cope with high inflation and their investments suffer great loss due to Federal Reserve engineer a hard landing of increasing 50bps to 75bps at every meeting causing the Financial Markets to tank.
Strong US dollar at its peak dosen't seem to help Americans coping with inflation importing foreign goods because additional cost (cost push inflation) was passed to consumers due to tax tariffs imposed (trade war) on China. US losing competitiveness because of strong dollar exporting expensive Americans goods and lacklustre tourism dollars post Covid 19 revenge travelling expected.
US Dollar Chart
Fund Flow
Fund Flow data point suggest getting mildly bearish sentiment where shorts and puts gradually reducing, when every man on the street was feeling doom and gloom from the recent drawdown, there are many Professional Traders views that financial markets have not bottom yet and more pain to come in coming months possibility of Recession is on the cards.
Conclusion
We are not far from a bottom and this is probably the best chance or opportunity to grab, go on bargain hunting where most Tech stocks had pullback between 50 to 70% with exceptions of
1) Apple all time high was 182 to 11 May low of 146, drawdown of 19.78% most resilient to recent drawdown.
2) The likes of other FAANG stocks Meta Platform (FB) all time high was 384 to recent low of 169 drawdown was 55.98%,
3) Amazon (AMZN) all time high was 3773.078 to recent 11 May low of 2088.57 drawdown was 44.64%
4) Netflix (NFLX) all time high was 700 to recent 11 May low of 165 drawdown was 76.43%
5) Google (GOOG) all time high was 3042 to recent 11 May low of 2251 drawdown was 26%
I wish my readers and supporters success in their investment journey.
Disclaimer: All news, information and charts shared is purely by my research and personal views only. This is not a trading recommendation or advice but on the basis of sharing information and educating the investment community. Different traders and investors adopt different trading strategies and risk management approach hence if in doubt please approach or seek clarifications with your Financial Adviser, Broker and Banker.


