
There are many speculations that China is losing the trade war and badly affect their domestic economy, that result in China central bank PBOC to warrant a Reserve Ratio Requirement (RRR) cut to stimulate and boost the economy, boost lending to SMEs in a liquidity crunch.
Financial Analysts or Foreign Exchange Traders interviewed by CNBC or Bloomberg spoke on the USDCNY currency pair and are split on whether it will breach 7 dollars mark or not given how China view in psychology that they are losing the trade war if it breach pass 7 dollars, a psychology win by President Trump to negotiate a better trade deal with China, it will also seen as China is manipulating its currency if it breach pass 7 dollars, China however will not want to see history repeat itself when capital outflows reach its peak in December 2016 at 6.9586 to 6.9604.
EconomicTimes Explains:
Definition: Also known as Cash Reserve Ratio, it is the percentage of deposits which commercial banks are required to keep as cash according to the directions of the central bank.
Description: The reserve ratio is an important tool of the monetary policy of an economy and plays an essential role in regulating the money supply. When the central bank wants to increase money supply in the economy, it lowers the reserve ratio. As a result, commercial banks have higher funds to disburse as loans, thereby increasing the money supply in an economy.
On the other hand, for controlling inflation, the CRR is generally increased, thereby decreasing the lending power of banks, which in turn reduces the money supply in an economy.
https://economictimes.indiatimes.com/definition/reserve-ratio
Investopedia Explains:
What is the 'Reserve Ratio'
The reserve ratio is the portion of reservable liabilities that depository institutions must hold onto, rather than lend out or invest. This is a requirement determined by the country's central bank, which in the United States is the Federal Reserve. As a simplistic example, assume the Federal Reserve determined the reserve ratio to be 11%. This means if a bank has deposits of $1 billion, it is required to have $110 million on reserve.
https://www.investopedia.com/terms/r/reserveratio.asp
Wikipedia Explains:
The reserve requirement (or cash reserve ratio) is a central bank regulation employed by most, but not all, of the world's central banks, that sets the minimum amount of reserves that must be held by a commercial bank. The minimum reserve is generally determined by the central bank to be no less than a specified percentage of the amount of deposit liabilities the commercial bank owes to its customers. The commercial bank's reserves normally consist of cash owned by the bank and stored physically in the bank vault(vault cash), plus the amount of the commercial bank's balance in that bank's account with the central bank.
The required reserve ratio is sometimes used as a tool in monetary policy, influencing the country's borrowing and interest rates by changing the amount of funds available for banks to make loans with.[1] Western central banks rarely increase the reserve requirements because it would cause immediate liquidity problems for banks with low excess reserves; they generally prefer to use open market operations (buying and selling government-issued bonds) to implement their monetary policy. The People's Bank of China uses changes in reserve requirements as an inflation-fighting tool, and raised the reserve requirement ten times in 2007 and eleven times since the beginning of 2010.
An institution that holds reserves in excess of the required amount is said to hold excess reserves.
https://en.wikipedia.org/wiki/Reserve_requirement
USDCNY Monthly Chart Historical

USDCNY Monthly Chart Historical with Technical Analysis

Economic Data from Trading Economic

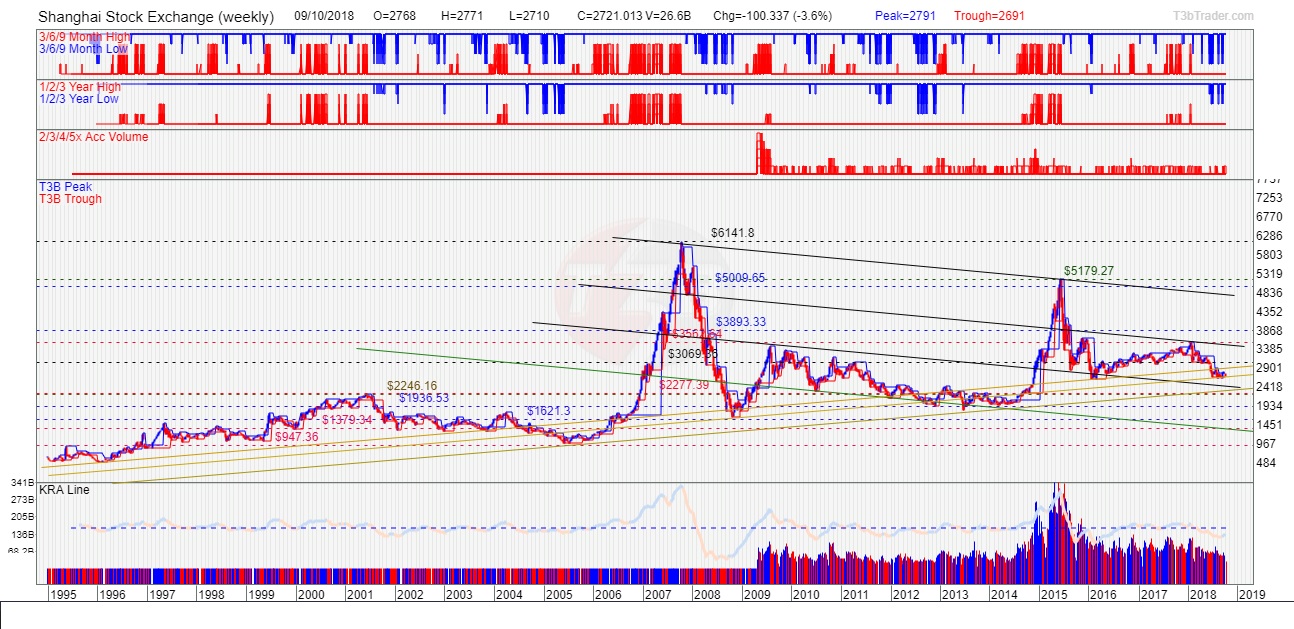
Shanghai Index Monthly Historical Chart
Based on Technical Analysis:
USDCNY is observed that 7 dollars benchmark is a valid resistance where speculations have been rife that China central bank would not allow that benchmark to be break and it would have many implications.
It is observed a mix of bullish and bearish chart formation of USDCNY pair,
Firstly a big rounding bottom with 7 dollars (estimated) resistance tested twice at the current moment. Ideally follow by a Cup and handle chart formation where green line cross intersect purple line after being resisted at 7 dollars (estimated) twice to finally break that psychology resistance.
Secondly a potential double top chart formation is observed M with 2 peaks seen tested at 7 dollars resistance level. Couple with the fact that USD shorts position is building up massively i would believe that USD spot has reach its peak at resistance between 96 to 97 and a selloff in USD is imminent, if it does so USDCNY would be seen going to retest its 2014 low at 6.03 level and 6 could be the psychology support.
Disclaimer: All news, information and charts shared is purely by my research and personal views only. This is not a trading recommendation or advice but on the basis of sharing information and educating the investment community. Different traders and investors adopt different trading strategies and risk management approach hence if in doubt please approach or seek clarifications with your Financial Adviser, Broker and Banker.


