Tickers

Fund Flow

Thursday 22 December 2022

Market Outlook For 2023 (Water Rabbit)

   Dear Readers,


First and foremost, I would like to wish everybody "Merry Christmas & Happy New Year" and I hope Year 2023 is a blessed year for all Traders & Investors, which will bring abundance in new opportunities, wealth and prosperity for everybody.

I am sorry that i have not been writing as frequently as i could due to my busy schedule. Nevertheless I would like to take this opportunity to update everybody on what are the dangers and opportunities in Year 2023 that you can take and ride your way throughout with ease.

The DANGER which i am referring to is there are too much market certainty surrounding how Federal Reserve will tackle the inflation issue where most asset prices, prices of products, services, raw materials and commodities rise across the board, the frequency of imminent interest rate hike, the severity of the increment in interest rate will cause the Financial Markets to collapse. 

Recession bells are ringing in year 2023 caused by the Federal Reserve excessive interest rate hike in year 2022 where interest rate begins with 0% to 0.25% to latest round of interest rate increase in December 2022 where Federal Reserve hike 0.5 basis point to 4.25% to 4.5%. Central Bank Federal Reserve are looking to hike interest rates pass 5% to 5.25% in year 2023.

Currently, my observations for Year 2023 where many Traders and Investors are calling for Federal Reserve to pivot and to lower interest rate to mitigate the slowdown in economy growth and fears of recession due to excessive interest rate hike, causing Big Tech firms like Meta, Amazon and Google have cut jobs and freeze hiring headcounts. 

https://www.wired.com/story/big-tech-layoffs-hiring/

Should Federal Reserve proceed with a gradual, pause and slower pace of frequency and severity of the increment in interest rate hike, the Bull market will last longer than unexpected. 

My opinion is there will be no recession in year 2023, contrary to Financial Markets will experience an upside rally breaking highs and create new highs despite interest rates reaching 5%. 

The Federal Reserve will not lower interest rate that risks of excessive money supplies that translates into higher inflation,  to pivot or lower interest rates in year 2023 meeting may signal to the public that America economy is contracting and experience a recessionary environment that require monetary stimulus to stimulate and boost the economy that will affect approval rating of President Biden Administration, inability to achieve economy growth to secure electoral votes in Presidential Election in year 2024. 

A shift to PetroYuan replacing PetroDollar may cause the USD to weaken, depreciate, losing world reserve currency crown, through losing PetroDollar benefit of consistent trade deficits and source of liquidity, inflow of foreign capital through PetroDollar recycling, US would be stuck with lots of extra dollars that would be no longer in demand, these dollars would return and flow back to US then translate to  massive inflation.

Higher possibility of the Federal Reserve may maintain pause in between monthly meetings on interest rate hike or slower rate of increment at 25 basis points with Federal Reserve target interest rate increase to 5% in year 2023.


The OPPORTUNITY which i am referring to is the THEME 

1) Price of Commodities will break all time high or set new high which have inverse relationship with USD, increased demand for raw materials and minerals for specific industry. (Electric Vehicles, Smart Apple Car, Renewable Energy industry, Defence).  

Commodities producers will channel more resources into investment to boost supplies when commodities price is price higher whereas vice versa commodities producers will limit any resources into investment causing shortage in supplies when commodities price is price lower.

Crude Oil Futures last close at 79.35 USD on 23 December 2022, price is currently supported at 70 USD floor with upside target of 115 USD to 125 USD in  year 2023. In order to secure more electoral votes during US mid terms elections in November 2022,  a total of 180 million barrels of crude oil was released from strategic reserves to mitigate price of energy inflationary pressure felt by US residents in the midst of Russia Ukraine war where US and allies enforce economic sanction crude oil and natual gas supplies embargo. Due to climate change, Russia Ukraine war, US favour renewable energy to fossils where infrastruture of renewables has not keep up with the demand, has caused disruptions and shortage of energy supplies. Oil released from the strategic reserves has result in dangerous low inventory level that require to re-stocking to pre-released inventory levels, so crude oil current trading at 79.35 USD, downside is limited supported at 70 USD level with attractive upside of risk reward ratios 2: 1. Although G7 economies join EU placed 60 USD price cap on Russian Oil will have limited downside at current levels, because this is a war between price taker and price setter, price taker G7 and EU will lose to price setter (Russia + OPEC) because an Oligopoly is a market characterized by a small number of firms who realize they are interdependent in their pricing and output policies, dominated by a small number of large sellers or producers enough to give each firm some market power. Oligopolies often result from the desire to maximize profits which can lead to collusion between firms. Reason for current crude oil revision lower was probably due to global economies enter into a recession in year 2023, deflationary pressure.

Crude Oil Technical Analysis


https://www.aljazeera.com/news/2022/10/19/biden-releasing-15-million-barrels-of-oil-from-strategic-reserve

https://www.barchart.com/story/news/12179723/g-7-joins-eu-on-60-per-barrel-price-cap-on-russian-oil?custom_url=news

Crude oil will have major catalyst move will be China growth resumes, a shift away from zero covid 19 policy and PetroDollar to PetroYuan, a shift away from international trade settlement payment like SWIFT to alternate CIPS, both will be used for international trade settlement and countries adopting CIPS international trade settlement payment will avoid international sanctions. Yuan will benefit from consistent trade deficits and source of liquidity, inflow of foreign capital through PetroYuan recycling, lead to Yuan strengthening. 

https://www.globaltimes.cn/page/202212/1281416.shtml

https://www.cips.org/

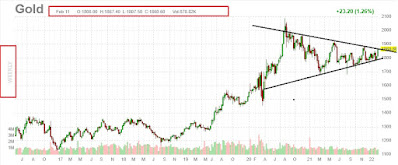
I forecast Gold price target for year 2023 is 2300 USD. China buying gold gradually diversifying from reduction in its US foreign reserves holdings. 

https://www.bloomberg.com/news/articles/2022-12-07/china-announces-jump-in-gold-reserves-after-more-than-3-years

https://asia.nikkei.com/Business/Markets/Commodities/China-thought-to-be-stockpiling-gold-to-cut-greenback-dependence

https://www.reuters.com/markets/commodities/chinas-reported-gold-reserves-rise-first-time-since-2019-2022-12-07/

https://www.scmp.com/economy/economic-indicators/article/3202672/china-stockpiling-gold-1-million-ounces-added-november-amid-beijings-asset-diversification-efforts

https://www.kitco.com/news/2022-12-07/China-buys-32-tonnes-of-gold-in-November-first-increase-in-reserves-since-2019.html

https://www.bullionstar.com/gold-university/chinese-central-bank-gold-buying

https://moneyweek.com/investments/commodities/gold/603131/how-much-gold-does-china-own

2) USD devaluation will hasten inflation to worsen in US which will be a key test for Federal Reserve to take action on their monetary policy and its direction. 

USD was trading at its peak at 114.75 on 28 September 2022, technically suggest downside bias to support level at 100, 90 and 80 respectively.

3) Industrials sectors comprising Aerospace & Defence, Electrical Equipment & Machinery, Buliding Construction and Transport & Logistics (Airfreight and Seafreight) 

Smart money will rotate into Industrial Sector, post covid 19 recovery taking shape where economies reopen without restrictions, increased demand for commodities, raw materials and minerals.  

Microprocessor Chip wars between USA & her allies like Japan, Taiwan, Holland and South Korea jointly limiting sales of high end microprocessor chips to China. Tech war contribute to lesser production of microchip growth to satisfy higher demand. Long Term Microprocessor chip manufacturing companies revenue growth may be affected by China R&D of high end microprocessor chips that proves to be self reliant and export to the other parts of the world. 

RCEP effective since early 2022 will be a key driver to Asia growth with China leading the pack. 

Price of toll at Suez Canal increase by 6% starting in February 2022. My friend who is in the import and export business updating me that Year 2022 container rates once reached 8000 USD and currently price of container rates was seen revising lower, but i believe container was not reflecting the potential geopolitical conflict in Asia Pacific where Shanghai was the world busiest port followed by Singapore PSA. The cost of transporting seafreight cargo container was not priced in with higher insurance result in increasing shipping costs passed to the consumers, operating in geopolitical conflict across South China Seas, Taiwan Straits.  


The World Busiest Port / Biggest Shipping Hub


Baltic Dry Index which measures global seafreight activities, the costs of shipping goods worldwide, is another important indicator to look at and assess whether global economies is booming or contracting, currently bottoming at 965 on 31 August 2022 after reaching high 5526 in October 2021. 

My Quantitative Finance model direct me to Industrials Sector rotation for these 2 months starting in November 2022.

Quant Model - Sector Rotation 


https://gcaptain.com/suez-canal-toll-increase-to-boost-revenue-by-400-million-chairman-says/#:~:text=The%20Suez%20Canal%20Authority%20announced,cruise%20ships%20and%20LNG%20carriers.

https://www.cnbc.com/2022/12/04/manufacturing-orders-from-china-down-40percent-in-demand-collapse.html

Sidetrack i has received dividends from China Cosco (HKSE: 01919) of 25K in HKD estimated 4K in SGD, which is 25% in dividend yield in year 2022 a result of exceptional revenue performance for year 2021/2022. 

China Cosco Dividend Payout For Year 2022


China Cosco Dividend Yield


4) Forex pair USDCNH is forecast strengthening to 6 level. strengthing CNH means inflation level is mitigated in China will spur more consumptions by the chinese. China growth story will save global economies from entering a recession from a shift in zero covid 19 policy and border reopening to international business and social travellers. China economy initially was export driven shift and transform into demand consumption economy. affluent chinese will consume more which will save global sluggish economy contracting or falling into a recession from post covid 19 recovery.

USDCNH Historical Chart


China has been reducing its USD foreign reserves for consecutive months in a bid to limit US financial weapons by sanctioning. Will this measure leads to USD to further depreciate in time to come?

https://www.spglobal.com/marketintelligence/en/mi/research-analysis/china-may-move-to-limit-impact-of-us-financial-weapons.html

There are good news and catalyst released yesterday by bloomberg on China relaxing its Zero Covid-19 measures and reopen its border to international business and social Travellers.  

https://www.bloomberg.com/news/articles/2022-12-22/china-to-cut-quarantine-for-overseas-travelers-from-next-month?fbclid=IwAR1wkXX9fxN1b3FgxxfieeaqYCbV5ytH85rgVRs2LgsXKhpXdgx5UXQzEgo&leadSource=uverify%20wall


I wish my readers all the best in their investing journey.


Disclaimer: All news, information and charts shared is purely by my research and personal views only. This is not a trading recommendation or advice but on the basis of sharing information and educating the investment community. Different traders and investors adopt different trading strategies and risk management approach hence if in doubt please approach or seek clarifications with your Financial Adviser, Broker and Banker.

Friday 30 September 2022

How To Export SQL Code To Excel Creating Chart Visualisations.

Dear Readers,


Please remember to hit subscribe & like button on my Youtube Channel. Many thanks for your support, appreciate it very much. 


https://youtu.be/3qnXvez3kjM 


Thursday 18 August 2022

How to save more money by choosing the correct Open Electricity Market (OEM) Plans?

 Dear Readers,


As you are aware that currently the world are experiencing high and expensive Utilities bills due to a series of world events:


  • Climate Change - heatwave across the globe prompt many to switch on Air-conditioner
  • Geopolitical military conflict causing economic sanctions and embargo on energy supplies
  • High demand of electricity from manufacturing industries like semiconductors, global data center, bitcoin mining activity, electric vehicles and consumers own more than 1 electronic devices.
  • High demand of energy commodities for power generation under cutting down on greenhouse gas emissions which can be reduced by making power with renewables and other climate friendly energy resources, where renewable energy are inefficient under cloudy, winds and water power plants are not always operating under full load. 
  • Quantitative Easing (QE) and low interest rate result in increasing money supplies causing hyperinflation to stimulate ailing economy.
  • Currency devaluation (weakening) imports inflation, Currency strengthening mitigate inflationary pressure. USD being the world reserve currency used for international trade settlement where commodities are priced denominated in USD settlement. 
  • Easing of border restrictions and compliance measure brought about economic activity recovery post covid-19, result in revenge travelling, products and services consumption.
  • Supplies chain disruptions, congestion and lockdown of ports triggered by Covid-19 widespread infection. 

https://www.reuters.com/business/energy/imf-says-russian-gas-embargo-could-hit-central-europe-hard-2022-07-19/

https://voxeu.org/article/western-sanctions-russia-are-working-energy-embargo-now-costly-distraction

https://www.fitchratings.com/research/corporate-finance/ukraine-war-intensifies-low-carbon-supply-chain-disruptions-01-04-2022

https://www.cnbc.com/2022/05/24/these-ports-are-causing-the-most-congestion-in-supply-chain.html


Many people on the street didn't see the inflation coming impacting and affecting their lives before US inflation hit 9.1% in June 2022.


Types of Inflation

Demand Pull : 

  • When the government lowers taxes, it also drives demand. 
  • Consumers have more discretionary income to spend on goods and services. 
  • When that increases faster than supply, it creates inflation. 
  • For example, tax breaks for mortgage interest rates increased demand for housing.

Cost Push :

  • Minimum Wage 
  • Trade Protectionism imposing or increasing trade tariffs.
  • The most common cause of Cost-Push inflation starts with an increase in the cost of production, which maybe expected or unexpected. For example, the cost of raw materials or inventory used in production might increase hence lead to higher costs.


Understanding Definition of Inflation and Deflation

  • Inflation is define as general increase in prices of products and services during economic expansion phase.
  • Deflation or recession is define as declining GDP growth of 2 and more consecutive quarters where prices of products and services treading lower in a downward trend due to declining price of raw materials commodities caused by the over exuberance in the financial markets resulting in a steep drawdown and nasty selloff,


How To Leverage & Capitalised On Increasing Utilities Costs?

Open Electricity Market (OEM)

Since 2001, Energy Market Authority (EMA) has progressively opened up the retail electricity market  to competition to allow business consumers more options to manage their energy cost.

Instead of buying from Singapore Power Group (SP Group) at the regulated tariff, eligible consumers can choose to buy electricity from :

  • A retailer at a price plan that best meet the needs or
  • The wholesale electricity market at the half hourly wholesale electricity prices.

Those who exercise thise choice are termed as contestable consumers.

In 2018, EMA began the rollout of the OEM initiative which allows 1.4 million consumer accounts, mainly households to enjoy more choices, savings and flexibility when buying electricity. 

Regardless of their choices, consumers would still enjoy the same reliable supply through the national power grid through peak and off peak hours without any supply disruption.

For more details on OEM can be found at www.openelectricitymarket.sg.


Regulated Tariff 


As a default option, residential consumers in Singapore buy electricity from Singapore Power Group (SP Group), a market support services company regulated by Energy Market Authority (EMA).

The tariff set by SP Group is reviewed every quarter (3 months) and is regulated by EMA to reflect the actual cost of electricity.

This tariff comprises 2 key components:

  1. Fuel Cost
  2. Non - Fuel cost
The fuel cost or cost of imported natural gas, is tied to oil prices by commercial contracts.

This changes are depending on global market conditions where non-fuel cost is the cost of generating and delivering electricity to homes.


Breakdown of Electricity Tariffs


Fuel Cost

This component of the tariff is calculated using the average of daily natural gas prices in the first 2 and a half month period in the preceding quarter.

For example: the average natural gas price between April and June is used to set the tariff for July to September.

This helps to smoothen out any large swings volatility in the oil markets. 

For households, this means electricity tariffs that are reflective of prevailing market conditions.

Around 95% of Singapore's electricity is generated from imported natural gas, the prices of natural gas are indexed to oil prices.

This is the market practice in Asia for natural gas contracts.


Non - Fuel Cost

This part of the tariff reflects the cost of generating and delivering electricity to consumers, includes

  • Power Generation Cost - 
    • This covers mainly the costs of operating the power stations, such as the manpower and maintenance costs, as well as the capital costs of the stations.
  • Network Costs - 
    • This is to recover the cost of transporting electricity through the power grid.
  • Market Support Services (MSS) Fee - 
    • This is to recover the costs of billing and meter reading, data management, retail market systems as well as for market development initiatives.
  • Power System Operation & Market Administration Fees - 
    • These fees are to recover the costs of operating the power system and administering the wholesale electricity market.


Technical Analysis of Natural Gas


Based on Natural Gas Chart Technical Analysis, bullish chart pattern observed was Cup & Handle and Ascending Triangle, Natural Gas all time high was 15.78 in December 2005, 

Natural Gas price is forecast and predicted to reach 13.52 using the depth of the cup & handle 9.42 (high) as a resistance - 5.325 (low) as a trough = 4.095 + 9.42 = 13.52

It was observed as well that price of Natural Gas and Crude Oil (WTI) had a divergence between them since July 2022 where Crude Oil (WTI)  price continue to descend while Natural Gas price rallied after reaching 5.325 (low) from 9.66 (high) set in June 2022 computed 44.99% drawdown from June 2022 high.

Natural Gas and Crude Oil both commodities have further upside target to break all time high 15.78 for Natural Gas and 147 for Crude Oil (WTI) hence electricity tariff will rise further causing inflationary pressure where consumers have to pay more for utilities.


Which Plans to Choose Fixed or Discounted?


When inflation occurs over an extended period of time due to economic expansion phase, driven by demand pull and cost push inflation, where govt lowers taxes and expanding M2 money supplies to save the ailing economy hit by black swan events subprime mortgage crisis and Covid-19 pandemic to stave off deflationary pressure in a recession where many people lose their jobs and earnings due to lockdown and layoffs.

Once we identified an uptrend for commodities which will contribute to inflationary pressure, therefore the course of action you need to take is lockdown your Utilities bills by signing up for a Fixed Price Plan (fixed rate) for the maximum tenure offered by the retailer Utilities service provider, fixed plan are offered by 12months, 24months and 36 months. 

Based on the above charts illustrations,  Fixed Price Plan (fixed rate) will be constant no change when the Utilities price are adjusted every quarters (3 months) by Energy Market Authority of Singapore (EMA) for the wholesale electricity market.

However there is a drawback when a consumer had a fixed rate plan contract at the peak of the inflation tied down with 12 months, 24 months and 36 months, the longer the term is contracted the higher loss is experience when regulated tariffs was adjusted lower every 3 months during the inital phase of deflation and reession where all asset prices collapse from the peak due to over exuberance.

To tackle this situation, consumer can switch to the discounted plan where the discounted regulated tariff was computed 20% discount off regulated tariff adjusted every quarter high or low. 

Unfortunately i last run a check on the discounted regulated tariff  price plan offering by the retail service provider at https://compare.openelectricitymarket.sg/#/pricePlans/list

There was no available price plan.


Conclusion

Consumer who signup for the fixed plan at the later stage, at the peak of the inflation will be the biggest losers. 

Regulated tariff will be adjusted lower every 3 months due to declining commodities raw materials price but consumer overpaid Utilities charges with a fixed plan which works against the consumer.

Only discounted regulated tariff plans benefit the consumers in a recession or deflationary environment.

Thursday 12 May 2022

Sell in May and Go Away

Dear Readers,

I hope everyone is surviving in this current Financial Markets drawdown or selloff since the start of the year 2022, we have reach the 5th month of the drawdown since January to current May.

I would like to refresh on the current situation of drawdown and selloff not amounting to a near term Recession which will be brought as a result of possibly a drawdown of 50% and beyond from all time high peak in January 2022. 

Financial Markets has overly reacted to repercussions of high commodities price especially driven by current ongoing geopolitical conflict Russia and Ukraine where Ukraine and Russia are agricultural and energy producers export to the world affecting supply chain disruptions and economic sanctions imposed on Russia. 

High inflation data point in US has peak in March 2022 at 8.5% and current data point in April registered at 8.3%, 0.2% reduction since March 2022 Federal Reserve raise 0.25% Federal Reserve Funds interest rate hike. 

Data suggest inflation has peak and could retrace to 5% and below in coming months as a result of interest rate hike in March (25bps), May (50bps) and possibility of  June (0.75bps) hike where current Financial Markets drawdown has priced in a probability 100% of 50bps to 75bps interest rate hike. 


https://www.allquant.co/post/may-2022-post-fomc-interest-rate-update?fbclid=IwAR0B_IAcAliV_ZGC5iOP4YEtekhD67hF-REX94iWYbt1xtmvNFOd5mae0ec

Inflation data retracement to 5% below could also be influence by the firstly by geopolitical conflict peaceful resolution ceasefire which could see high commodities price taking a breather arising from embargo and economic sanctions, supplies chain disruptions, Secondly, Shanghai China ommicron infections dwindled and ease lockdown in Shanghai where manufacturing and port (automate logistics truck drivers and port operations ) resuming activities. Thirdly, US end trade war with China abolish or partially abolish trade tariffs on Chinese goods to combat inflation raging rampantly.     


https://tradingeconomics.com/united-states/inflation-cpi  

I would like to update on an opportunity now up for grab should the Financial Market has reached the bottom.

Financial Markets usually forward guidance looking based on expectations on inflation data point to signs of abating will react positively.

https://corporatefinanceinstitute.com/resources/knowledge/valuation/forward-pe-ratio/

Current fund flow data points to 0% probability for Recession, for the next 2-3 years for global economies are recovering from post Covid 19 induced recession 2 years on since year 2020 where global Financial Markets drawdown was between 26% to 40%. 

Bull market on average last 5 years and 2 months so Bull market are forecast to end sometime in 2025 but it could drag longer to 10 years. We are going to reach Centennial milestone of year 1929 Great Depression by year 2029.  

https://therobusttrader.com/how-long-do-bull-markets-last/#:~:text=On%20average%2C%20a%20bull%20market%20lasts%20for%20about,bull%20markets%20are%20much%20longer%20than%20bear%20markets.


Technical Analysis

Dow Jones Industrial Average - Weekly

Dow Jones all time high was 36952.65 on 3 Jan 2022 had drawdown computed to 11 May low 31798.86 was a difference of 5153.79 (13.95%)  which we observed Dow Jones has pullback and retrace to upper channel lines of the price channel.

Nasdaq Composite - Weekly

Nasdaq Composite all time high was 16212.23 on 22 Nov 2021 had drawdown computed to 11 May low 11339.18 was a difference of 4873.05 (30.06%)  which we observed Nasdaq Composite has pullback and retrace to upper channel lines of the price channel.

S&P 500 - Weekly

S&P 500 all time high was 4818.62 on 3 Jan 2022 had drawdown computed to 11 May low 3928.82 was a difference of 889.80 (18.46%)  which we observed SPX has pullback and retrace to upper channel lines of the price channel.

Quants Algorithm

SPY


SPY drawdown of 55.2% happened during the subprime mortgage crisis in 2007-2009 of that magnitude scale based on historical data. current year 2022 drawdown for SPY is estimated 19.06% slightly over 20% level coin as Technical Bear market.


QQQ


QQQ drawdown of 83% happened during the Dot.com bubble crisis in 2000 -2003 of that magnitude scale based on historical data. current year 2022 drawdown for QQQ high was 408.71 to 11 May low of 290.95 is estimated 28.81% surpassed 20% level coin as Technical Bear market.


Strong US Dollar

Recent opinion poll conducted by Washington Post/ABC News survey points to overall approval rating for President Biden and his Democrats Party Cadres was at 42%, The poll finds President Biden's approval rating on the economy stands at 38% down from 52% a year ago and just 28% approve of the way the president is handling inflation compare with 68% who disapprove. 

https://sg.news.yahoo.com/poll-day-biden-approval-rating-225621306.html

President Biden has to act fast and doublely hard to win back approval ratings because Mid Term Elections is fast approaching in November 2022, does President Biden wish to crash the Financial Markets under his watch with a hard landing, most Americans are suffering having to cope with high inflation and their investments suffer great loss due to Federal Reserve engineer a hard landing of increasing 50bps to 75bps at every meeting causing the Financial Markets to tank. 

Strong US dollar at its peak dosen't seem to help Americans coping with inflation importing foreign goods because additional cost (cost push inflation) was passed to consumers due to tax tariffs imposed (trade war) on China. US losing competitiveness because of strong dollar exporting expensive Americans goods and lacklustre tourism dollars post Covid 19 revenge travelling expected. 


US Dollar Chart


Fund Flow 

Fund Flow data point suggest getting mildly bearish sentiment where shorts and puts gradually reducing, when every man on the street was feeling doom and gloom from the recent drawdown, there are many Professional Traders views that financial markets have not bottom yet and more pain to come in coming months possibility of Recession is on the cards.


Conclusion

We are not far from a bottom and this is probably the best chance or opportunity to grab, go on bargain hunting where most Tech stocks had pullback between 50 to 70% with exceptions of 

1) Apple all time high was 182 to 11 May low of 146, drawdown of  19.78% most resilient to recent drawdown. 

2) The likes of other FAANG stocks Meta Platform (FB) all time high was 384 to recent low of 169 drawdown was 55.98%, 

3) Amazon (AMZN) all time high was 3773.078 to recent 11 May low of 2088.57 drawdown was 44.64%

4) Netflix (NFLX) all time high was 700 to recent 11 May low of 165 drawdown was 76.43%

5) Google (GOOG) all time high was 3042 to recent 11 May low of 2251 drawdown was 26%


I wish my readers and supporters success in their investment journey.


Disclaimer: All news, information and charts shared is purely by my research and personal views only. This is not a trading recommendation or advice but on the basis of sharing information and educating the investment community. Different traders and investors adopt different trading strategies and risk management approach hence if in doubt please approach or seek clarifications with your Financial Adviser, Broker and Banker.


Wednesday 16 February 2022

Will Gold Breakout of Consolidating Range?

 Dear Valued Readers & Supporters,

Gold Future Weekly Chart


US Inflation Rate: Source Tradingeconomics.com


Correlation Between US Dollar and Gold


I saw an opportunity so i am sharing an analysis on Gold Futures which is an opportunity up for grab?

Above charting illustration shows Gold Future depict GOLD futures is consolidating in a range, will there be a breakout to the upside target of 2100 USD or a failed futile attempt false breakout or breakout to the downside trget of 1500 USD?

There are many maecro events which will cause Gold Future to breakout or breakdown?

1) Geopolitical conflict - US Russia Ukraine first & US China Taiwan next.

2) Hyper inflation caused by Cost Push and Demand Pull inflation with supply chain disruptions of transporting products, goods and commoditites raw materials, containers jammed and shut down of ports due to widespread of omicron covid-19 variant, Suez Canal toll fee to rise by 6% in February 2022. Including Gold in the portfolio is a good hedge of inflation where correlation is positive.

3) correlation between US dollar and commodities, where US dollar has an inverse relationship with commodities denominated in US dollar settlement. devaluing of US dollar will made commodities attractive as a hedge.

Technical Analysis suggest Gold was consolidating in a symmetric triangle range, could breakout anytime and a new trend will be establish to the upside. Gold all time high was in August 2020 where price reach was 2089 USD and it had since pullback and drawdown from all time high to March, April and August 2021 low of 1673, 1677 and 1677 respectively. Using simple math to calculate the drawdown is 2089 (high) -1673 (low) = 416 / 2089 = 19.91% drawdown from all time high in August 2020. 

Gold could reach price level range between 2717 USD to 3000 USD (psychological resistance) on a longer timeframe where current secular Bull market for commodities continued since year 2000 on China growth story, strong appetite demand for commodities. Using simple math to calculate the forecast 2089 (high) minus 1045 (december 2015 low) = 1044 + 1673 (recent low in March 2021) = 2717 USD. 

In conclusion, gold upside in this secular bull market for commodities continued on the backdrop of a possible proxy geopolitical war of Russia Ukraine and China Taiwan, both Russia and China view Ukraine and Taiwan as their national security and terms set out for peaceful resolution where Ukraine should not join NATO and Taiwan Independence will trigger the war to breakout. couple with inlfation out of control as a result of Quantitatice Easing (QE) increasing money supplies M2 to stimulate economic disruptions caused by Covid 19.

I wish my readers and supporters success in their investment journey.


Disclaimer: All news, information and charts shared is purely by my research and personal views only. This is not a trading recommendation or advice but on the basis of sharing information and educating the investment community. Different traders and investors adopt different trading strategies and risk management approach hence if in doubt please approach or seek clarifications with your Financial Adviser, Broker and Banker.

Monday 24 January 2022

Premium Subscription Based Exclusive Content On Patreon

Dear Readers,


Greetings!


I would like to thank you for your great support over the years since 2017, 5 years ago which I had started my journey on blog content creation.


I have launched my prsence on Patreon, an American membership platform that provide business tools for content creators to run a subscription service. It helps creators and artists earn a monthly income by providing rewards and perks to their subscribers. 


Please find my link to patreon @ https://www.patreon.com/contrariantraderinvestor?fan_landing=true, where you can find exclusive content on my specialised Fund Flow Analysis couple with my preferred Technical Analysis indicators, trade ideas and opportunities where i employ strategies, signals and indicators from Quantitative Investing & Hedge Fund Financial Modelling.


https://www.patreon.com/contrariantraderinvestor?fan_landing=true


In Conclusion, my VIP Patron package price at $99 USD per month, only limits to first lucky 100 subscribers, where they will find value in their investment journey profiting in the full market Bull and Bear cycle, subscribers can decide not to renew the monthly VIP Patron package should they find it of no value to them, Once subscriber join my VIP Patron package, they will not be subjected to buy high sell low where many retails investor lose money given their weak psychology, Market Maker / Operator (Swap Dealer) to conduct daily operations of hunting stop loss on retail investor trade positions.


I wish my readers success in their investment journey.


Disclaimer: All news, information and charts shared is purely by my research and personal views only. This is not a trading recommendation or advice but on the basis of sharing information and educating the investment community. Different traders and investors adopt different trading strategies and risk management approach hence if in doubt please approach or seek clarifications with your Financial Adviser, Broker and Banker.


Sunday 9 January 2022

Market Outlook For Year 2022 (Water Tiger)

 Dear Readers,


First and foremost, I would like to wish everybody "Happy New Year" and I hope Year 2022 is a blessed year which will bring abundance in new opportunities and new hope for everybody.

I am sorry that i have not been writing as frequently as i could due to my busy schedule. Nevertheless I would like to take this opportunity to update everybody on what are the dangers and opportunities in Year 2022 that you can take and ride your way throughout with ease.

The DANGER which i am referring to is how Federal Reserve will tackle the inflation issue where most asset prices, prices of products, services, raw materials and commodities rise across the board, the frequency of imminent interest rate hike, the severity of the increment in interest rate will cause the Financial Markets to collapse. Should Federal Reserve proceed with a gradual and slower pace of frequency and severity of the increment in interest rate hike, the Bull market will last longer than unexpected.

The OPPORTUNITY which i am referring to is the THEME 

1) Price of Commodities will break all time high or set new high which have inverse relationship with USD, increased demand for raw materials and minerals for specific industry. (Electric Vehicles, Smart Apple Car, Renewable Energy industry, Defence),  Commodities producers will channel more resources into investment to boost supplies.

2) USD devaluation will hasten inflation to worsen in US which will be a key test for Federal Reserve to take action on their monetary policy and its direction.

3) Logistic Supply Chain like Airfreight and Seafreight will receive a booster post covid 19 era where economies reopen without restrictions, highly transmission of omicron covid 19 variant to temporary shut down of ports and cause supplies chain disruptions, increased demand for commodities, raw materials and minerals, RCEP effective in year 2022 will be a key driver to Asia growth with China leading the pack, Price of toll at Suez Canal increase by 6% starting in February 2022.

https://gcaptain.com/suez-canal-toll-increase-to-boost-revenue-by-400-million-chairman-says/#:~:text=The%20Suez%20Canal%20Authority%20announced,cruise%20ships%20and%20LNG%20carriers.

4) Utilities like Fossil Fuel power plant generating electricity or alternative Renewable energy like (Solar, Wind and Turbine) and Nuclear Energy power plant will be boosted and forecast with energy supplies disruption, shortage of fossil fuels where Indonesia curtail Thermal coal exports ban limiting supplies to deal with potential electricity supplies disruption, climate change (Snowstorm, heatwave, storms) and natural Disasters disrupting energy supplies will result in increased demand for fossil and other alternatives to generate electricity to keep our electronic devices, factories and business operating, There are increased demand for electricity from Electric Vehicles, Drones, Bitcoin Mining consume massive electricity to mine bitcoin, Server operating 24 hours 7 days where Airconditioning is needed to cool, Electric Scooter and Bike, smart phones, apple watch, ipads, tablets and home appliances. Efficiency in renewable energys supplies in quesion where the given production capacities for electric energy have a theoretical value, which could be obtainable under ideal conditions. They are measuring the generatable amount of energy that would be reached under permanent and full use of all capacities of all power plants. In practise this isn't possible because Solar collectors are less efficient under clouds, also Wind and Water Turbine power plants are not always operating under full load. All these values are only useful in relation to other energy sources or countries. Use of Nuclear energy complicates environmental concerns and Health Hazards with disposing nuclear reactor waste and countries are exploring reintroducing Nuclear energy to solve their energy supplies disruption.

https://www.worlddata.info/america/usa/energy-consumption.php

https://www.reuters.com/business/indonesia-minister-says-emergency-over-coal-supply-crunch-cnbc-indonesia-2022-01-07/

5) Forex pair USDCNH is forecast strengthening to 6 level. strengthing CNH means inflation level is mitigated in China will spur more consumptions by the chinese. 


I wish my readers all the best in their investing journey.


Disclaimer: All news, information and charts shared is purely by my research and personal views only. This is not a trading recommendation or advice but on the basis of sharing information and educating the investment community. Different traders and investors adopt different trading strategies and risk management approach hence if in doubt please approach or seek clarifications with your Financial Adviser, Broker and Banker.